Model Improvement

Enhancing Predictive Performance with Model Evaluation

Weekly design


Pre-class video

  • Eng ver.
  • Kor ver.
  • Pre-class PPT pdf

Discussion

Discussion #10

Class

Training data to fit diverse models using caret package

  • Regardless of the technique or algorithm used in ML, the common process required is learning.

  • The object of learning is the training dataset, and there are numerous ways to learn from the training data.

    • Each method has distinct principles, characteristics, and nuances, and there are various approaches. Knowing all algorithms has its limits.
  • When faced with a practical problem, one must consider what to adopt and determine the appropriate parameter values to create a suitable model.

  • The caret package offers convenient functions for training data to develop predictive models.

    • A standardized interface allows for testing around 300 machine learning algorithms.

    • Easy tuning is possible by configuring different parameter scenarios and measuring variable importance.

    • Through convenient training data learning, you can receive assistance in making an informed algorithm selection decision.

caret package: Classification And REgression Training

  • Classification if the dependent variable (predictor) is a nominal (categorical) variable

  • Regression if it is a continuous variable

library(tidyverse) # for tidy tools (pipe operation, tibble, etc..)
── Attaching core tidyverse packages ──────────────────────── tidyverse 2.0.0 ──
✔ dplyr     1.1.4     ✔ readr     2.1.5
✔ forcats   1.0.0     ✔ stringr   1.5.1
✔ ggplot2   3.5.1     ✔ tibble    3.2.1
✔ lubridate 1.9.3     ✔ tidyr     1.3.1
✔ purrr     1.0.2     
── Conflicts ────────────────────────────────────────── tidyverse_conflicts() ──
✖ dplyr::filter() masks stats::filter()
✖ dplyr::lag()    masks stats::lag()
ℹ Use the conflicted package (<http://conflicted.r-lib.org/>) to force all conflicts to become errors
library(caret)
Loading required package: lattice

Attaching package: 'caret'

The following object is masked from 'package:purrr':

    lift
  • Data: Sonar: Mines Vs. Rocks

This is the data set used by Gorman and Sejnowski in their study of the classification of sonar signals using a neural network. The task is to train a network to discriminate between sonar signals bounced off a metal cylinder and a roughly cylindrical rock. Each pattern is a set of 60 numbers in the range 0.0 to 1.0. Each number represents the energy within a particular frequency band, integrated over a certain period of time. The label associated with each record contains the letter R if the object is a rock and M if it is a mine (metal cylinder). The numbers in the labels are in increasing order of aspect angle, but they do not encode the angle directly.

# install.packages("mlbench")

set.seed(1234) # for reproducibility

data(Sonar, package = "mlbench")

Sonar %>% glimpse
Rows: 208
Columns: 61
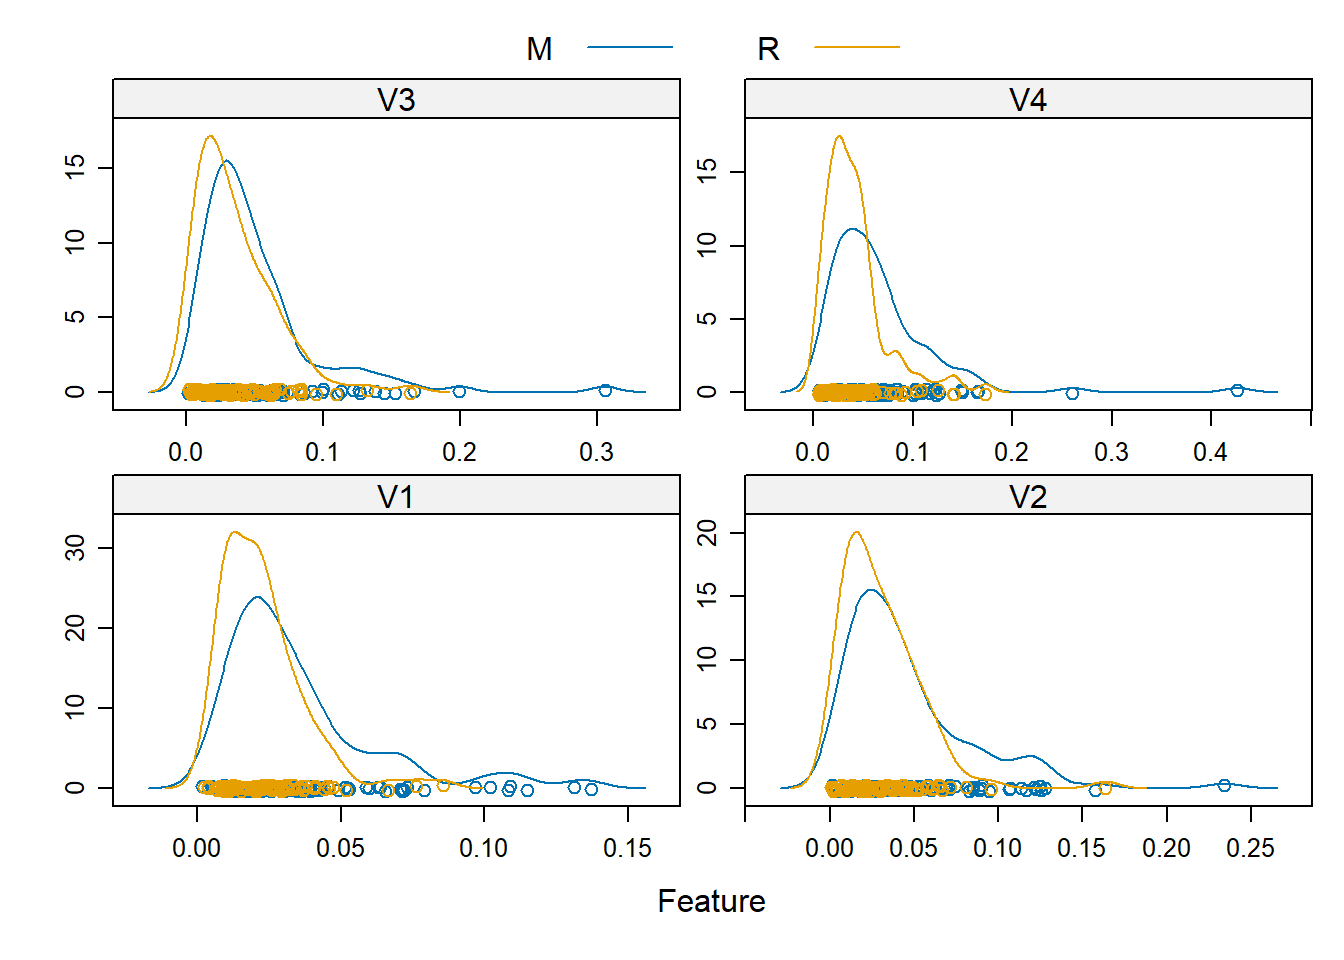
$ V1    <dbl> 0.0200, 0.0453, 0.0262, 0.0100, 0.0762, 0.0286, 0.0317, 0.0519, …
$ V2    <dbl> 0.0371, 0.0523, 0.0582, 0.0171, 0.0666, 0.0453, 0.0956, 0.0548, …
$ V3    <dbl> 0.0428, 0.0843, 0.1099, 0.0623, 0.0481, 0.0277, 0.1321, 0.0842, …
$ V4    <dbl> 0.0207, 0.0689, 0.1083, 0.0205, 0.0394, 0.0174, 0.1408, 0.0319, …
$ V5    <dbl> 0.0954, 0.1183, 0.0974, 0.0205, 0.0590, 0.0384, 0.1674, 0.1158, …
$ V6    <dbl> 0.0986, 0.2583, 0.2280, 0.0368, 0.0649, 0.0990, 0.1710, 0.0922, …
$ V7    <dbl> 0.1539, 0.2156, 0.2431, 0.1098, 0.1209, 0.1201, 0.0731, 0.1027, …
$ V8    <dbl> 0.1601, 0.3481, 0.3771, 0.1276, 0.2467, 0.1833, 0.1401, 0.0613, …
$ V9    <dbl> 0.3109, 0.3337, 0.5598, 0.0598, 0.3564, 0.2105, 0.2083, 0.1465, …
$ V10   <dbl> 0.2111, 0.2872, 0.6194, 0.1264, 0.4459, 0.3039, 0.3513, 0.2838, …
$ V11   <dbl> 0.1609, 0.4918, 0.6333, 0.0881, 0.4152, 0.2988, 0.1786, 0.2802, …
$ V12   <dbl> 0.1582, 0.6552, 0.7060, 0.1992, 0.3952, 0.4250, 0.0658, 0.3086, …
$ V13   <dbl> 0.2238, 0.6919, 0.5544, 0.0184, 0.4256, 0.6343, 0.0513, 0.2657, …
$ V14   <dbl> 0.0645, 0.7797, 0.5320, 0.2261, 0.4135, 0.8198, 0.3752, 0.3801, …
$ V15   <dbl> 0.0660, 0.7464, 0.6479, 0.1729, 0.4528, 1.0000, 0.5419, 0.5626, …
$ V16   <dbl> 0.2273, 0.9444, 0.6931, 0.2131, 0.5326, 0.9988, 0.5440, 0.4376, …
$ V17   <dbl> 0.3100, 1.0000, 0.6759, 0.0693, 0.7306, 0.9508, 0.5150, 0.2617, …
$ V18   <dbl> 0.2999, 0.8874, 0.7551, 0.2281, 0.6193, 0.9025, 0.4262, 0.1199, …
$ V19   <dbl> 0.5078, 0.8024, 0.8929, 0.4060, 0.2032, 0.7234, 0.2024, 0.6676, …
$ V20   <dbl> 0.4797, 0.7818, 0.8619, 0.3973, 0.4636, 0.5122, 0.4233, 0.9402, …
$ V21   <dbl> 0.5783, 0.5212, 0.7974, 0.2741, 0.4148, 0.2074, 0.7723, 0.7832, …
$ V22   <dbl> 0.5071, 0.4052, 0.6737, 0.3690, 0.4292, 0.3985, 0.9735, 0.5352, …
$ V23   <dbl> 0.4328, 0.3957, 0.4293, 0.5556, 0.5730, 0.5890, 0.9390, 0.6809, …
$ V24   <dbl> 0.5550, 0.3914, 0.3648, 0.4846, 0.5399, 0.2872, 0.5559, 0.9174, …
$ V25   <dbl> 0.6711, 0.3250, 0.5331, 0.3140, 0.3161, 0.2043, 0.5268, 0.7613, …
$ V26   <dbl> 0.6415, 0.3200, 0.2413, 0.5334, 0.2285, 0.5782, 0.6826, 0.8220, …
$ V27   <dbl> 0.7104, 0.3271, 0.5070, 0.5256, 0.6995, 0.5389, 0.5713, 0.8872, …
$ V28   <dbl> 0.8080, 0.2767, 0.8533, 0.2520, 1.0000, 0.3750, 0.5429, 0.6091, …
$ V29   <dbl> 0.6791, 0.4423, 0.6036, 0.2090, 0.7262, 0.3411, 0.2177, 0.2967, …
$ V30   <dbl> 0.3857, 0.2028, 0.8514, 0.3559, 0.4724, 0.5067, 0.2149, 0.1103, …
$ V31   <dbl> 0.1307, 0.3788, 0.8512, 0.6260, 0.5103, 0.5580, 0.5811, 0.1318, …
$ V32   <dbl> 0.2604, 0.2947, 0.5045, 0.7340, 0.5459, 0.4778, 0.6323, 0.0624, …
$ V33   <dbl> 0.5121, 0.1984, 0.1862, 0.6120, 0.2881, 0.3299, 0.2965, 0.0990, …
$ V34   <dbl> 0.7547, 0.2341, 0.2709, 0.3497, 0.0981, 0.2198, 0.1873, 0.4006, …
$ V35   <dbl> 0.8537, 0.1306, 0.4232, 0.3953, 0.1951, 0.1407, 0.2969, 0.3666, …
$ V36   <dbl> 0.8507, 0.4182, 0.3043, 0.3012, 0.4181, 0.2856, 0.5163, 0.1050, …
$ V37   <dbl> 0.6692, 0.3835, 0.6116, 0.5408, 0.4604, 0.3807, 0.6153, 0.1915, …
$ V38   <dbl> 0.6097, 0.1057, 0.6756, 0.8814, 0.3217, 0.4158, 0.4283, 0.3930, …
$ V39   <dbl> 0.4943, 0.1840, 0.5375, 0.9857, 0.2828, 0.4054, 0.5479, 0.4288, …
$ V40   <dbl> 0.2744, 0.1970, 0.4719, 0.9167, 0.2430, 0.3296, 0.6133, 0.2546, …
$ V41   <dbl> 0.0510, 0.1674, 0.4647, 0.6121, 0.1979, 0.2707, 0.5017, 0.1151, …
$ V42   <dbl> 0.2834, 0.0583, 0.2587, 0.5006, 0.2444, 0.2650, 0.2377, 0.2196, …
$ V43   <dbl> 0.2825, 0.1401, 0.2129, 0.3210, 0.1847, 0.0723, 0.1957, 0.1879, …
$ V44   <dbl> 0.4256, 0.1628, 0.2222, 0.3202, 0.0841, 0.1238, 0.1749, 0.1437, …
$ V45   <dbl> 0.2641, 0.0621, 0.2111, 0.4295, 0.0692, 0.1192, 0.1304, 0.2146, …
$ V46   <dbl> 0.1386, 0.0203, 0.0176, 0.3654, 0.0528, 0.1089, 0.0597, 0.2360, …
$ V47   <dbl> 0.1051, 0.0530, 0.1348, 0.2655, 0.0357, 0.0623, 0.1124, 0.1125, …
$ V48   <dbl> 0.1343, 0.0742, 0.0744, 0.1576, 0.0085, 0.0494, 0.1047, 0.0254, …
$ V49   <dbl> 0.0383, 0.0409, 0.0130, 0.0681, 0.0230, 0.0264, 0.0507, 0.0285, …
$ V50   <dbl> 0.0324, 0.0061, 0.0106, 0.0294, 0.0046, 0.0081, 0.0159, 0.0178, …
$ V51   <dbl> 0.0232, 0.0125, 0.0033, 0.0241, 0.0156, 0.0104, 0.0195, 0.0052, …
$ V52   <dbl> 0.0027, 0.0084, 0.0232, 0.0121, 0.0031, 0.0045, 0.0201, 0.0081, …
$ V53   <dbl> 0.0065, 0.0089, 0.0166, 0.0036, 0.0054, 0.0014, 0.0248, 0.0120, …
$ V54   <dbl> 0.0159, 0.0048, 0.0095, 0.0150, 0.0105, 0.0038, 0.0131, 0.0045, …
$ V55   <dbl> 0.0072, 0.0094, 0.0180, 0.0085, 0.0110, 0.0013, 0.0070, 0.0121, …
$ V56   <dbl> 0.0167, 0.0191, 0.0244, 0.0073, 0.0015, 0.0089, 0.0138, 0.0097, …
$ V57   <dbl> 0.0180, 0.0140, 0.0316, 0.0050, 0.0072, 0.0057, 0.0092, 0.0085, …
$ V58   <dbl> 0.0084, 0.0049, 0.0164, 0.0044, 0.0048, 0.0027, 0.0143, 0.0047, …
$ V59   <dbl> 0.0090, 0.0052, 0.0095, 0.0040, 0.0107, 0.0051, 0.0036, 0.0048, …
$ V60   <dbl> 0.0032, 0.0044, 0.0078, 0.0117, 0.0094, 0.0062, 0.0103, 0.0053, …
$ Class <fct> R, R, R, R, R, R, R, R, R, R, R, R, R, R, R, R, R, R, R, R, R, R…
table(Sonar$Class)

  M   R 
111  97 

Scatterplot Matrix

A scatterplot matrix shows a grid of scatterplots where each attribute is plotted against all other attributes. It can be read by column or row, and each plot appears twice, allowing you to consider the spatial relationships from two perspectives. An improvement of just plotting the scatterplots, is to further include class information. This is commonly done by coloring dots in each scatterplot by their class value.

fig <- function(width, heigth){
     options(repr.plot.width = width, 
             repr.plot.height = heigth)
}

fig(10,10)

featurePlot(x=Sonar[,1:4], 
            y=Sonar[,61], 
            plot="pairs", 
            auto.key=list(columns=2))

For example, in Iris dataset,

fig(10,10)
featurePlot(x=iris[,1:4], 
            y=iris[,5], 
            plot="pairs",
            auto.key=list(columns=3))

Density Plots

Density estimation plots (density plots for short) summarize the distribution of the data. Like a histogram, the relationship between the attribute values and number of observations is summarized, but rather than a frequency, the relationship is summarized as a continuous probability density function (PDF). This is the probability that a given observation has a given value. The density plots can further be improved by separating each attribute by their class value for the observation. This can be useful to understand the single-attribute relationship with the class values and highlight useful structures like linear separability of attribute values into classes.

fig(10, 5)
featurePlot(x=Sonar[,1:4], 
            y=Sonar[,61], 
            plot="density", 
            scales=list(x=list(relation="free"), 
                        y=list(relation="free")), 
            auto.key=list(columns=2))

For example, in Iris dataset,

fig(10, 5)
caret::featurePlot(x=iris[,1:4], 
            y=iris[,5], 
            plot="density", 
            scales=list(x=list(relation="free"), 
                        y=list(relation="free")), 
            auto.key=list(columns=3))

Hold out method: (7:3 rule)

# Without package
indexTrain <- sample(1:nrow(Sonar), 
                     round(nrow(Sonar) * .7))
training <- Sonar[ indexTrain, ]
testing  <- Sonar[-indexTrain, ]
table(training$Class)

 M  R 
75 71 
table(testing$Class)

 M  R 
36 26 

Partitioning using createDataPartition()

  • There is a factor, making it convenient for partitioning based on a specific ratio.

    • p = .7 means 70% training 30% test
  • When using the sample() function, it performs complete random sampling, disregarding the factor ratio of the dependent variable. However, when using the createDataPartition() function, it supports stratified random sampling based on the factor ratio of the dependent variable, which is more effective.

  • By default, the returned type is a list. If the list argument value is set to FALSE, a vector is output.

indexTrain <- createDataPartition(Sonar$Class, p = .7, list = F)
training <- Sonar[ indexTrain, ]
testing  <- Sonar[-indexTrain, ]
table(training$Class)

 M  R 
78 68 
table(testing$Class)

 M  R 
33 29 

For the best parameter tuning

  • The parameters must be set accordingly, such as k in KNN, mtry and ntre in RF

  • With caret, the “Tuning parameters” feature helps identify optimal parameters based on data using methods like LOOCV, K-fold cross-validation, and more.

  • The number of tuning parameters varies for each algorithm. For instance, in the case of the number of parameters is \(p\), candidate models are tested by searching a grid of \(3^p\).

  • For example, in KNN, which has a single parameter K, three K values (\(3^1 = 3\)) are used as candidates, and the models are compared.

  • For a model with two parameters, there are 9 combinations (\(3^2 = 9\)) of parameter values used as candidates, and the models are compared.

  • If K-fold cross-validation is chosen as the comparison method, determining the number of folds (K) is also necessary.

  • The trainControl() function helps evaluate by consistently applying a uniform comparison method to each candidate.

The following code creates a configuration that repeats 10-fold cross-validation five times to find the best candidate’s parameter grid. The fitControl object, which contains information on how to compare models, is later utilized in the learning process.

fitControl <- trainControl(method = "repeatedcv", number = 10, repeats = 5)

Now let’s train with the training data set!

The standardized interface for learning is the train() function: You can implement the desired learning model algorithm by changing the method argument in the function

rf_fit <- train(Class ~ ., 
                data = training, 
                method = "rf", 
                trControl = fitControl, 
                verbose = F)
rf_fit
Random Forest 

146 samples
 60 predictor
  2 classes: 'M', 'R' 

No pre-processing
Resampling: Cross-Validated (10 fold, repeated 5 times) 
Summary of sample sizes: 131, 131, 132, 131, 132, 131, ... 
Resampling results across tuning parameters:

  mtry  Accuracy   Kappa    
   2    0.8025714  0.5995588
  31    0.7763810  0.5476392
  60    0.7608571  0.5146801

Accuracy was used to select the optimal model using the largest value.
The final value used for the model was mtry = 2.
  • mtry candidates are automatically set to 2, 31, and 60
  • Of these, mtry = 2 was finally selected based on Kappa statistics and accuracy.
  • If you want to see the selection process in detail, set verbose = F and run
plot(rf_fit)

Let’s summarize various performance evaluation indicators

  • Accuracy: Overall correctness of the model’s predictions. Measures the proportion of correct predictions.

    \[ \frac{TP + TN}{TP + TN + FP + FN} \]


  • Precision: Proportion of true positive predictions among all positive predictions. High precision means fewer false positives.

    \[ \frac{TP}{TP + FP} \]

  • Recall: Proportion of true positive predictions among all actual positive instances. Also known as sensitivity or true positive rate.

    \[ \frac{TP}{TP + FN} \]


  • Sensitivity is the same index with Recall

  • Specificity: Proportion of true negative predictions among all actual negative instances. Also known as true negative rate.

    \[ \frac{TN}{TN + FP} \]

  • FP Rate: Proportion of false positive predictions among all actual negative instances. Also known as false positive rate.

    \[ \frac{FP}{FP + TN} \]

  • F1 Score: Harmonic mean of precision and recall. Provides a balanced measure between the two.

    \[ \frac{2 \cdot (Precision \cdot Recall)}{Precision + Recall} \]

  • Kappa: Measures the agreement between the model’s predictions and the expected outcomes, taking into account the possibility of agreement by chance.

    \[ \frac{Accuracy - RandomAccuracy}{1 - RandomAccuracy} \]

Model Validation

Let’s compete fairly among the models using various indicators

modelLookup() %>% head(10)
         model parameter            label forReg forClass probModel
1          ada      iter           #Trees  FALSE     TRUE      TRUE
2          ada  maxdepth   Max Tree Depth  FALSE     TRUE      TRUE
3          ada        nu    Learning Rate  FALSE     TRUE      TRUE
4       AdaBag    mfinal           #Trees  FALSE     TRUE      TRUE
5       AdaBag  maxdepth   Max Tree Depth  FALSE     TRUE      TRUE
9     adaboost     nIter           #Trees  FALSE     TRUE      TRUE
10    adaboost    method           Method  FALSE     TRUE      TRUE
6  AdaBoost.M1    mfinal           #Trees  FALSE     TRUE      TRUE
7  AdaBoost.M1  maxdepth   Max Tree Depth  FALSE     TRUE      TRUE
8  AdaBoost.M1 coeflearn Coefficient Type  FALSE     TRUE      TRUE
modelLookup("rpart")
  model parameter                label forReg forClass probModel
1 rpart        cp Complexity Parameter   TRUE     TRUE      TRUE

Let’s train the same data fitting to four different models (DT, RF, KNN, NB)

dt_fit <- train(Class ~ ., 
                data = training, 
                method = "rpart", 
                trControl = fitControl)

rf_fit <- train(Class ~ ., 
                data = training, 
                method = "rf", 
                trControl = fitControl)

knn_fit <- train(Class ~ ., 
                 data = training, 
                 method = "knn", 
                 trControl = fitControl)

nb_fit <- train(Class ~ ., 
                data = training, 
                method = "nb", 
                trControl = fitControl)
Warning in FUN(X[[i]], ...): Numerical 0 probability for all classes with
observation 10
Warning in FUN(X[[i]], ...): Numerical 0 probability for all classes with
observation 11
Warning in FUN(X[[i]], ...): Numerical 0 probability for all classes with
observation 11
Warning in FUN(X[[i]], ...): Numerical 0 probability for all classes with
observation 11
Warning in FUN(X[[i]], ...): Numerical 0 probability for all classes with
observation 10
resamp=resamples(list(DecisionTree=dt_fit,
                      RandomForest=rf_fit, 
                      kNN=knn_fit, 
                      NaiveBayes=nb_fit))

dotplot() shows Accuracy and Kappa for all models included in resamples()

dotplot(resamp)

Use predict() which is a generic function of Testing models

predict(rf_fit, newdata = testing)
 [1] M R R R R R M M R R R R R R R M R R R R R R R R M R R R R M M M R M R M M M
[39] M M M M M M M M M M M M M M M R M M M M M M M M
Levels: M R
table(predict(rf_fit, newdata = testing),
      testing$Class)
   
     M  R
  M 30  5
  R  3 24

If you add confusionMatrix() of the caret package, you can output various statistics including confusion matrix and accuracy.

predict(rf_fit, newdata = testing) %>% 
  confusionMatrix(testing$Class)
Confusion Matrix and Statistics

          Reference
Prediction  M  R
         M 30  5
         R  3 24
                                          
               Accuracy : 0.871           
                 95% CI : (0.7615, 0.9426)
    No Information Rate : 0.5323          
    P-Value [Acc > NIR] : 1.5e-08         
                                          
                  Kappa : 0.7398          
                                          
 Mcnemar's Test P-Value : 0.7237          
                                          
            Sensitivity : 0.9091          
            Specificity : 0.8276          
         Pos Pred Value : 0.8571          
         Neg Pred Value : 0.8889          
             Prevalence : 0.5323          
         Detection Rate : 0.4839          
   Detection Prevalence : 0.5645          
      Balanced Accuracy : 0.8683          
                                          
       'Positive' Class : M               
                                          

Custom search grid: Grid adjustment of tuning parameters

  • When selecting the optimal parameters, the search range and grid can be manually adjusted

  • The candidates for mtry, which are automatically determined by the 3P formula: 2, 31, and 60

  • If you want to compare with more candidates, you set the candidates yourself

  • The code below changes the mtry candidates to 1, 2, 3, 4, 5, 6, 7, 8, 9, and 10 and sets them up.

customGrid <- expand.grid(mtry = 1:10)

rf_fit2 <- train(Class ~ ., 
                 data = training, 
                 method = "rf", 
                 trControl = fitControl, 
                 tuneGrid = customGrid, 
                 verbose = F)

rf_fit2
Random Forest 

146 samples
 60 predictor
  2 classes: 'M', 'R' 

No pre-processing
Resampling: Cross-Validated (10 fold, repeated 5 times) 
Summary of sample sizes: 131, 132, 131, 132, 131, 131, ... 
Resampling results across tuning parameters:

  mtry  Accuracy   Kappa    
   1    0.7942784  0.5805762
   2    0.8014505  0.5967626
   3    0.8041978  0.6031289
   4    0.8038022  0.6023856
   5    0.7965348  0.5875659
   6    0.8005201  0.5949173
   7    0.8029963  0.5991999
   8    0.8018681  0.5975455
   9    0.7996117  0.5931190
  10    0.7993114  0.5929248

Accuracy was used to select the optimal model using the largest value.
The final value used for the model was mtry = 3.

Generic plot() function shows the Accuracy change depending on mtry grid

plot(rf_fit2)

Random Search Grid: random selection of tuning parameter combinations

  • As the number of tuning parameters increases, the number of search grids increases exponentially, and the search process may become inefficient due to the grid configuration with equal intervals

  • Let’s train through RDA (Regularized Discriminant Analysis) with two tuning parameters

rda_fit <- train(Class ~ ., 
                 data = training, 
                 method = "rda", 
                 trControl = fitControl, 
                 verbose = F)

rda_fit
Regularized Discriminant Analysis 

146 samples
 60 predictor
  2 classes: 'M', 'R' 

No pre-processing
Resampling: Cross-Validated (10 fold, repeated 5 times) 
Summary of sample sizes: 131, 132, 131, 132, 132, 131, ... 
Resampling results across tuning parameters:

  gamma  lambda  Accuracy   Kappa     
  0.0    0.0     0.5604762  0.07758973
  0.0    0.5     0.7583810  0.51039188
  0.0    1.0     0.6845714  0.35894233
  0.5    0.0     0.7892381  0.56724332
  0.5    0.5     0.7835238  0.55523021
  0.5    1.0     0.7415238  0.47753750
  1.0    0.0     0.6467619  0.28747059
  1.0    0.5     0.6508571  0.29649203
  1.0    1.0     0.6607619  0.31605195

Accuracy was used to select the optimal model using the largest value.
The final values used for the model were gamma = 0.5 and lambda = 0.
  • You can see a total of 9 parameter combinations being compared

  • The user search grid introduced just above can also be searched for equally spaced grids using the expand.grid() function, but this time, let’s configure a parameter combination that is not equally spaced using a random search grid.

  • search = "random" in the trainControl() function, change the search type to random.

plot(rda_fit)

fitControl <- trainControl(method = "repeatedcv", 
                           number = 10, 
                           repeats = 5, 
                           search = "random")
rda_fit2 <- train(Class ~ ., data = training, 
                  method = "rda", 
                  trControl = fitControl, 
                  verbose = F)
rda_fit2
Regularized Discriminant Analysis 

146 samples
 60 predictor
  2 classes: 'M', 'R' 

No pre-processing
Resampling: Cross-Validated (10 fold, repeated 5 times) 
Summary of sample sizes: 131, 131, 132, 131, 132, 131, ... 
Resampling results across tuning parameters:

  gamma      lambda     Accuracy   Kappa    
  0.1028932  0.7653744  0.7679267  0.5290507
  0.2431458  0.1114396  0.7786886  0.5494464
  0.5760511  0.1579374  0.7845128  0.5593490

Accuracy was used to select the optimal model using the largest value.
The final values used for the model were gamma = 0.5760511 and lambda
 = 0.1579374.
  • There are two tuning parameters, gamma and lambda, but the moment you change the search type to random, you can see that the candidate group is not set with the 3P formula.

  • To manually increase the number of tuning parameter combinations, use the tuneLength argument of the train() function.

rda_fit2 <- train(Class ~ ., 
                  data = training, 
                  method = "rda", 
                  trControl = fitControl, 
                  tuneLength = 50, 
                  verbose = F)
rda_fit2
Regularized Discriminant Analysis 

146 samples
 60 predictor
  2 classes: 'M', 'R' 

No pre-processing
Resampling: Cross-Validated (10 fold, repeated 5 times) 
Summary of sample sizes: 132, 131, 131, 132, 131, 131, ... 
Resampling results across tuning parameters:

  gamma         lambda      Accuracy   Kappa    
  0.0007485631  0.74191082  0.7589084  0.5144843
  0.0414835601  0.01287166  0.7601758  0.5158588
  0.0783394738  0.52302887  0.7627179  0.5177754
  0.0981407929  0.34136666  0.7629084  0.5187975
  0.1215299605  0.93627195  0.7394799  0.4679774
  0.1290835007  0.63893257  0.7604176  0.5107336
  0.1291675451  0.37643517  0.7682418  0.5286955
  0.1332780691  0.60682541  0.7659560  0.5224079
  0.1338704182  0.74118555  0.7476703  0.4841626
  0.1602785466  0.97047875  0.7409084  0.4712820
  0.1618139972  0.20392341  0.7891136  0.5719495
  0.1777139497  0.42049942  0.7629084  0.5168299
  0.1794137117  0.58848017  0.7699560  0.5298930
  0.1810493851  0.02484183  0.7931136  0.5803734
  0.2031416909  0.18328472  0.7928938  0.5790880
  0.2145218640  0.93273889  0.7490989  0.4860594
  0.2352795987  0.96551055  0.7435751  0.4758013
  0.2794060404  0.48901564  0.7685128  0.5254606
  0.3231490329  0.99972542  0.7489084  0.4872199
  0.3873158591  0.12334491  0.7833700  0.5562390
  0.3908691760  0.19369314  0.7863223  0.5619009
  0.3929732225  0.53632580  0.7654505  0.5172339
  0.4569480976  0.22765241  0.7836557  0.5550322
  0.4665695983  0.46639755  0.7724029  0.5308909
  0.4692936756  0.78518915  0.7545275  0.4967273
  0.4850399913  0.50985965  0.7695458  0.5249073
  0.5070618326  0.96435422  0.7541465  0.4979233
  0.5164007600  0.14748781  0.7810842  0.5493820
  0.5246395844  0.43766934  0.7764029  0.5389038
  0.6293819949  0.65953016  0.7559267  0.4989787
  0.6405648568  0.36828794  0.7764982  0.5381764
  0.6644365741  0.40821422  0.7710696  0.5275948
  0.6681491192  0.75535534  0.7518608  0.4919304
  0.6803096321  0.66944697  0.7518315  0.4908615
  0.7028437410  0.76722496  0.7503370  0.4883800
  0.7059634458  0.47948041  0.7710696  0.5283761
  0.7216346122  0.79049471  0.7544322  0.4969646
  0.7362087339  0.85754167  0.7490989  0.4878771
  0.7754983467  0.03475408  0.7658315  0.5161669
  0.8180513082  0.68751588  0.7495604  0.4872603
  0.8333342015  0.05593821  0.7646886  0.5140673
  0.8594429099  0.86730980  0.7274652  0.4452287
  0.8617005984  0.50849207  0.7491648  0.4837251
  0.8719446701  0.77311713  0.7345275  0.4579433
  0.8930286658  0.75939288  0.7207985  0.4307518
  0.8987579306  0.63752126  0.7274505  0.4421286
  0.9058322918  0.19435659  0.7534505  0.4908708
  0.9212931057  0.34698021  0.7396410  0.4637153
  0.9602838892  0.64811097  0.6875458  0.3651033
  0.9788019210  0.24244529  0.6807692  0.3499658

Accuracy was used to select the optimal model using the largest value.
The final values used for the model were gamma = 0.1810494 and lambda
 = 0.02484183.
  • By randomly setting 50 parameters, we consider the optimal parameter tuning method that is slightly more flexible.

  • In comparison, it can be seen that the value of the adopted parameter has more decimal points and has naturally become more precise.

plot(rda_fit2)